|
Teaching Non-Ideal Reactors with CFD Tools Movie Gallery |
|
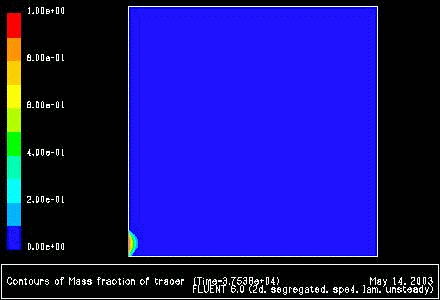
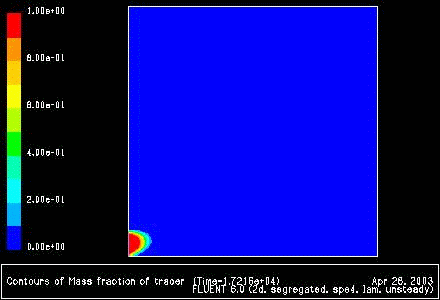
The following movies illustrate the concentration evolution of a tracer inside the reactor. Initially, the reactor is full of water (blue), and a step profile in the concentration of a tracer (red) is imposed at the inlet boundary. Since the
convective characteristic time is significantly smaller than the diffusive
characteristic time, we present two movies with different times between
images, to illustrate both processes of transport. In the
first movie, the normalized time difference between images is Dq = 0.005, and the final normalized time is q =
1.5. L/H=1 Re=10
To play the movie click on the picture. To download it click here with the right button of the mouse and select Save Target as... (Internet Explorer) or Save Link as... (Netscape). In the second
movie, the normalized time difference between images is Δq = 0.04, and the final normalized time is q = 10.
To play the movie click on the picture. To download it click here with the right button of the mouse and select Save Target as... (Internet Explorer) or Save Link as... (Netscape). |
|
Introduction Geometry Picture Gallery Movie Gallery |