|
Teaching Non-Ideal Reactors with CFD Tools Picture Gallery |
|
The
following pictures illustrate the concentration evolution of a tracer inside
the reactor. Initially, the reactor is full of water (blue), and a step profile in the
concentration of a tracer (red) is imposed at the inlet boundary. The
reduced time is defined as q =
t/t, where t
represents the
space-time. The streamlines are shown in black. L/H=1
Re=10 q = 0.1
q = 0.22
q = 1
q = 5
These
pictures clearly illustrate that approximately at q = 0.22 one starts to ‘see’ tracer
at the reservoir outlet. In addition, even for a very long time of operation
(about 5 times the residence time), the reservoir is not completely full of tracer, due to the large stagnant zone. Now, we
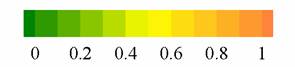
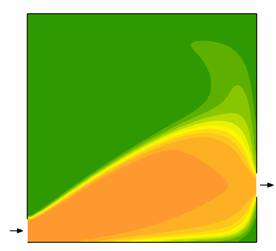
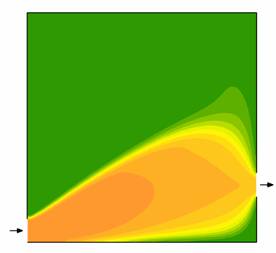
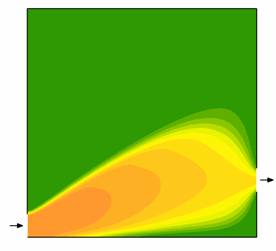
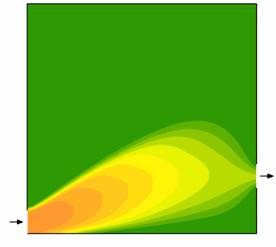
illustrate the steady-state concentration field of a reagent (orange) which undergoes a 1st-order
irreversible reaction, originating a product species (green).
The influence of the Damkholer number, Da = kτ,
is illustrated. L/H=1
Re=10 Concentration
of reagent
Da = 0.5 Da = 1 Da = 2
Da = 5 |
|
Introduction Geometry Picture Gallery Movie Gallery |